Histomorphology, hormonal changes and redox imbalance in aluminum-induced Pituitary-gonadal axis toxicity of adult Wistar Rats: the ameliorating influence of Prosopis Africana aqueous stem bark-extract
Olawuyi T Solomon, Ukwenya V Okoliko, Akinola B Kolade, Ogunjemite P Idaresit
Olawuyi T Solomon*, Ukwenya V Okoliko, Akinola B Kolade, Ogunjemite P Idaresit
Department of Human Anatomy, School of Health and Health Technology, Federal University of Technology, P. M. B 704, Akure, Ondo-State
- *Corresponding Author:
- Olawuyi T Solomon
Department of Human Anatomy, School of Health and Health Technology, Federal University of Technology, P. M. B 704, Akure, Ondo-State
Tel: +234(0)8038134827
E-mail: tsolawuyi@futa.edu.ng
Received Date: November 04, 2021; Accepted Date: November 19, 2021; Published Date:November 26, 2021
Copyright: © Solomon OT, Okoliko UV, Kolade AB, Idaresit OP (2021) Histomorphology, Hormonal Changes and Redox Imbalance in Aluminum-Induced Pituitary-gonadal Axis Toxicity of Adult Wistar Rats: the Ameliorating Influence of Prosopis Africana Aqueous Stem Bark-Extract. J Rep Endo Infert. Vol.6 No.6: 32.
Abstract
Prosopis Africana has found explorative use across several countries in Africa, in this modern-day; some of the uses include treatment of migraine, dysentery, rheumatism, and menstrual pain. This study aims at investigating the effects of Prosopis Africana aqueous stem bark-extract on the Pituitary-ovarian axis of adult Wistar rats following aluminum chloride administration.
Six groups of five animals each were utilized in the study and the study lasted for four weeks. Group, I served as the control and was fed with standard chow and water only. Group II animals were administered with 1000mg/kg b/w of extract only, Group III were given AlCl3 (100 mg/kg b/w) followed by ascorbic acid (20 mg/kg b.w), Group IV were given AlCl3 (100 mg/kg b/w) followed by 1000 mg/kg b/w of the extract for another 2 weeks, Group V were given AlCl3 (100 mg/kg b/w) followed by 500 mg/ kg b/w of the extract while Group VI received 100 mg/kg b/w of AlCl3 only. Animal sacrifice, samples were collected. Data obtained were analyzed using one-way ANOVA. The intake of different doses of AlCl3, extract, and ascorbic acid presented a classical histo-architectural appearance corresponding with the hormone and biochemical profiles. Prosopis africana markedly reversed biochemical, hormonal, and histological alterations caused by aluminum toxicity in the ovary and pituitary gland. Prosopis Africana reversed oxidative stress induced by aluminum toxicity in the ovary and pituitary gland. Indeed, Prosopis Africana is a potent anti-oxidant.Keywords
Aluminum; Histo-architecture; Ovary; Pituitary gland; Prosopis Africana
Introduction
Recently, owing to its serious effects on the central nervous system, energy metabolism, hematology and reproduction, greater attention has been paid to aluminum [1]. This contaminant induces the generation of free radicals, which can cause neurotoxicity and infertility [2,3]. Aluminum and several metals are redistributed naturally in the environment by both geologic and biologic cycles and account for one of the commonest inducers of ovarian toxicity [4,5].
Prosopis Africana has found explorative use across several countries in Africa [6]. In modern times, its uses include the treatment of migraine, dysentery rheumatism, and menstrual pain [7,8]. The presence of flavonoids, tannins, glycosides, carbohydrates, saponins and alkaloids in different parts of the plant was shown by the phytochemical screening of Prosopis Africana [6]. Its effect on the ovary via the pituitary gland is not scientifically understood. This study, therefore, is aimed at investigating the influence of Prosopis Africana on the pituitary gland and ovaries of female adult Wistar rats following aluminum toxicity.
Materials and Methods
The stem-bark of Prosopis africana was gotten from Oke-Ogun Ondo, State, ELISA kits (Monobind Inc, CA 92630, ab10866, SE120087 USA), Aluminum Chloride crystals (Lot No: 20150321, Guangdong Sci-Tech, China). Types of equipment used are Microtome (Leica RM 2125 RTS), Rotary evaporator (RE-52A from Union Laboratories England), Vacuum Pump, Centrifuge (Denly, Model BS 400), sensitive weighing balance (Mettler Toledo, Mg 126), Automatic tissue processor 9), 96-microplate reader (model SM 600, China), Chemistry Analyzer machine (MISPA Excel), Water bath (model MH-8504), Adjustable pipettes (Surepette RS 16013), Electric oven (Model: DHG-9030A, Searches instrument).
Preparation of Extracts
Taxonomic identification and authentication of the plant samples were done at the Centre for Research and Development (CERAD), FUTA Ondo state where it was assigned an Herbarium number FUTA/0218. A copy of the corresponding voucher was kept at the herbarium. The stem barks were washed with running tap water, cut in pieces, and allowed to shade-dry for one week after which it was pounded and pulverized into a fine powder using a grinding machine. The powdered stem bark was macerated in ethanol for 48 hours and then filtered. Using a rotary evaporator, the filtrate was concentrated and further concentrated to dryness in an electric oven at 50oC. The concentrated solution was stored at 40°C in a refrigerator until it was used.
Breeding of the Animals
Thirty adult female Wistar rats weighing averagely 170g were procured and housed in cages under a photo-periodicity of 12- hour light/12-hour dark cycle at room temperature in the Animal House facility of the Department of Human Anatomy, Federal University of Technology Akure (FUTA). The rats received pellets and water ad libitum and were allowed to acclimatize for 14 days. Procedures involving animals in this study conformed to the National Institutes of Health Guide for the Care and Use of Laboratory Animals (NRC, 2010).
Experimental Design
The rates were separated into six groups of five animals per group. Distilled water, Prosopis africana extracts, and aluminum chloride (AlCl3) were administered to the animals via oral gavage as below:
Group I (control) = rat pellets and distilled water.
Group II = 1000mg/kg b/wextract of Prosopis africana only
Group III= 100mg/kg b/wAlCl3 for 2 weeks + ascorbic acid for 2 weeks
Group IV = 100mg/kg b/wAlCl3 for 2 weeks + 1000mg/kg b/wof Prosopis africana for 2 weeks
Group V = 100mg/kg b/wAlCl3 for 2 weeks + 500mg/kg b/wof Prosopis africana for 2 weeks
Group VI = 100mg/kg b/wof AlCl3 only
Animal Sacrifice and Sample Collection
Twenty-four hours after the last administration, the animals were weighed and euthanized. Craniotomy and laparoscopy were performed to excise the pituitary gland and ovarian tissues respectively, which were thereafter processed for light microscopy. Blood was also collected via cardiac puncture and used for hormonal assays.
Histological Analysis
The pituitary glands and ovaries were excised and blotted dry, fixed in formaldehyde, and calcium chloride while the ovaries were fixed in 10% formo-saline. The recommended procedures for tissue processing and hematoxylin and eosin staining of Drury & Wallington (1967) were followed. Each sample was cut into small pieces (3-5 mm thick) and further fixed for another 15 hours to adjust the same fixative. For 12 hours, the set tissue specimens were trimmed and washed in tap water. To dehydrate the tissue specimens, an alcohol sequence was used. The tissue specimens were washed and embedded in paraffin with xylene. The tissue specimens were washed and embedded in paraffin with xylene. The paraffin blocks on a rotary microtome were cut into 5-micron slices. On glass slides, the obtained tissue parts were mounted and stained with Hematoxylin and Eosin.
Hormonal Assay
Serum FSH, LH, and estradiol were quantified using an enzymelinked immunosorbent assay (ELISA) commercial kit (Accubind, USA). The tests were carried out according to the manufacturer’s instructions.
Luteinizing Assay Procedure
LH was quantitatively determined according to manufacturer instruction based on the method. Twenty-five microns (25μl) of the standard, the specimens, and controls were dispensed into appropriate wells. Twenty-five microns (25μl) of enzyme conjugate reagent was pipetted into the wells and thoroughly mixed for 30seconds and incubate at a temperature of 36°C for 60 minutes. The micro titer wells were rinsed and flicked 5 times with three hundred microns (300μl) of washing solution. The wells were struck sharply with absorbent paper to remove all residual water. A hundred microns (100μl) of TMB substrate solution was added to each well and mixed and then incubated at room temperature for 15 minutes. The reactions were stopped using a hundred microns (100μl) of stopping solution. The samples were gently mixed for 30 seconds until the blue color changes to yellow. Absorbance were measured with an automatic spectrophotometer (model SM 600, Micro plate Reader) at 450 nm within 15 minutes [6].
Follicle Stimulating Hormone Assay Procedure
25 microns (μl) of the standard, the specimens, and controls were dispensed into appropriate wells. 50μl of enzyme conjugate reagents were pipetted into the wells and thoroughly mixed for 30seconds and incubated at a temperature of (36°C) for 60minutes. The micro titer wells were rinsed and flicked 5 times with three hundred microns (300μl) of washing solution. The wells were struck sharply with absorbent paper to remove all residual water. A hundred microns (100μl) of TMB substrate solution was added to each well and mixed and then incubated at room temperature for 15 minutes [9]. The reactions were stopped using a hundred microns (100μl) of stopping the solution. The samples were gently mixed for 30 seconds until the blue color changed to yellow. Absorbance was read at 450 nm with a microliter well reader within 15 minutes.
Serum Assay Oestradiol Procedure
Before the procedure began, all reagents, serum references, and controls were brought to room temperature (20-27°C). The micro plates’ wells were formatted for each serum reference, control, and rat specimens that were to be assayed in duplicate. Any unused micro well strips were replaced into the aluminum bag sealed and stored at 2-8°C. 0.025 ml Pipette of appropriate serum reference, control to specimen assigned to the well. 0.05 ml of Estradiol Biotin Reagent was added to all wells. The micro plate was swirled gently for 20-30 minutes at room temperature. 0.050 ml (50 μl) of Estradiol Enzyme reagent was added directly on top of the reagents dispensed to all wells. The micro plate was swirled gently for 20-30 minutes to mix and after was covered and incubated for 90 minutes at room temperature [8-10]. The contents of the micro plate were then discarded by decantation and the plate was blotted to dry with absorbent paper. 350μl of washed buffer was added to properly decant the contents; this process was repeated 2 more times for a total of 3 washes with the use of a squeeze bottle. 0.100 ml (100μl) of the substrate solution was added to all wells in the same order to minimize reaction time difference between the wells. After which incubation at room temperature was done for 20 minutes. 0.050ml (50μl) of stop solution was added in the same order to each well and was gently mixed for 15-20 seconds. The reading for the absorbance was taken in each well at 450nm. The results were read within 30 minutes of adding the stop solution [11].
Biochemical Assessments
The blood was centrifuged at 2000 revolution per minute for 10 minutes in a centrifuge. The collected serum samples were used for the estimation of the biochemical markers, malondialdehyde (MDA) to estimate lipid peroxidation and Catalase.
Malondialdehyde (MDA)
Malondialdehyde levels in plasma were measured according to the protocol outlined by Stocks and Domandy. The reaction mixture contained 100μL of Plasma, 20% Trichloroacetic acid (1.0ml) mixed, and centrifuge at 2000 rpm for 5mins to obtain the supernatant. 0.5ml of supernatant was mixed with 0.7% Thiobarbituric acid (1.0ml); the tubes were heated in a water bath at 100oc for 20 minutes and subsequently cooled in water [12]. Enzyme activity was calculated by the relative difference in uptake read by Chemistry Analyzer machine (MISPA Excel) at 450nm.
Catalase
Catalase activity was determined according to the method, the reaction mixture contained 100μL of Plasma, 1000 μL distilled water, and 1000 μL Hydrogen peroxide. Mixed with vortex and incubate at 37°C for 3 min, after that 2000 μL Dichromate/ Acetic acid was then added. After that, the tubes were kept at 100°C for 10 min. After cooling with tap water, centrifuged to remove precipitated protein (2500 g for 5 min), the changes in absorbance were recorded at 450 nm against the reagent blank. Catalase activity was estimated from a standard curve prepared using various concentrations of hydrogen peroxide. Enzyme activity was calculated by the relative difference in uptake read by Chemistry Analyzer machine (MISPA Excel) at 450nm.
Statistical analysis
Statistical analyzes were done using Graph Pad Prism version 8.03. Data were presented as means ± Standard deviation (SEM) for the groups. Data were considered statistically significant when the p-value is ≤0.05.
Results
Histopathological Findings
Figure 1 Representative pituitary gland micrograph of adult female Wistar rats for Group I (control). Arrows indicate acidophilic and basophilic cells. The anterior and posterior pituitary is distinct from pars intermediate in-between. GE = glandular epithelium in the anterior pituitary, Staining: H&E. Magnification: A: X100; B: X400 (Figure 1).
Figure 1 Representative pituitary gland micrograph of adult female Wistar rats for Group I (control). Arrows indicate acidophilic and basophilic cells. The anterior and posterior pituitary is distinct from pars intermediate in-between. GE = glandular epithelium in the anterior pituitary. Staining: H&E. Magnification: A: X100; B: X400.
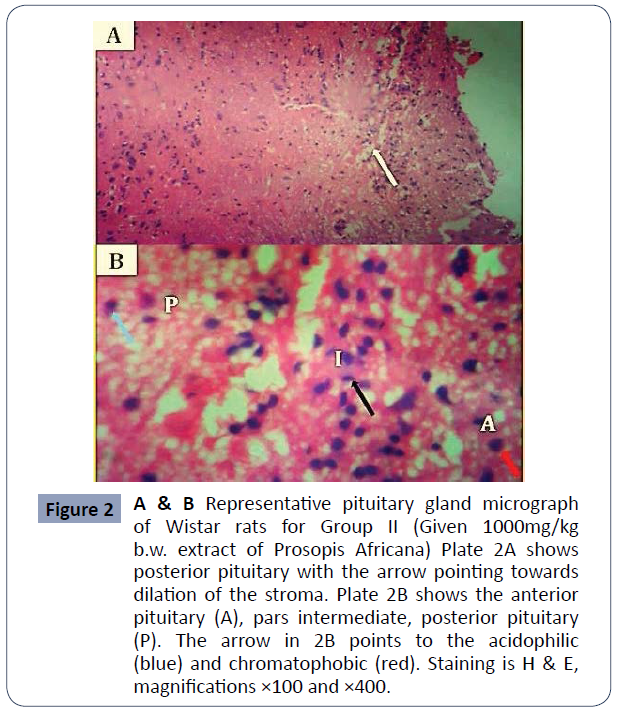
Figure 2 A & B: Representative pituitary gland micrograph of Wistar rats for Group II (Given 1000mg/kg b/wextract of Prosopis Africana) Plate 2A shows posterior pituitary with the arrow pointing towards dilation of the stroma. Plate 2B shows the anterior pituitary (A), pars intermediate, posterior pituitary (P). The arrow in 2B points to the acidophilic (blue) and chromatophobic (red), Staining is H & E, magnifications x100 and x400 (Figure 2).
Figure 2 A & B Representative pituitary gland micrograph of Wistar rats for Group II (Given 1000mg/kg b.w. extract of Prosopis Africana) Plate 2A shows posterior pituitary with the arrow pointing towards dilation of the stroma. Plate 2B shows the anterior pituitary (A), pars intermediate, posterior pituitary (P). The arrow in 2B points to the acidophilic (blue) and chromatophobic (red). Staining is H & E, magnifications ×100 and ×400.
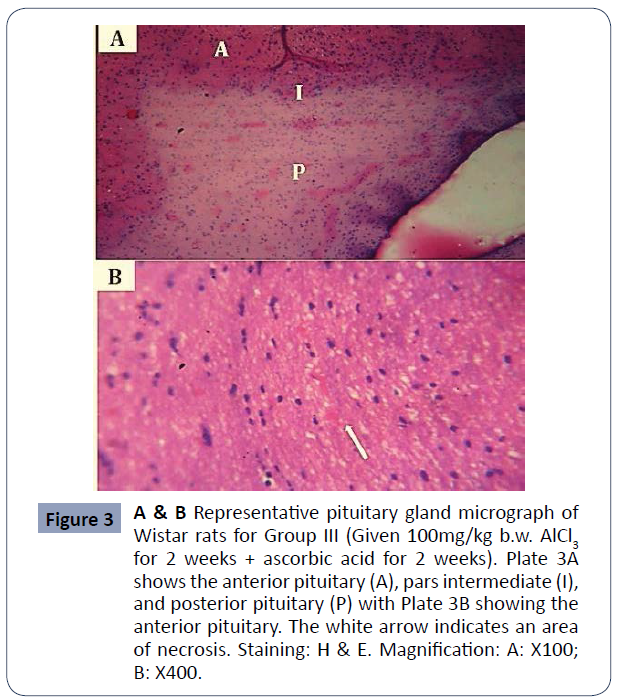
Figure 3A & B: Representative pituitary gland micrograph of Wistar rats for Group III (Given 100mg/kg b/wAlCl3 for 2 weeks + ascorbic acid for 2 weeks). Plate 3A shows the anterior pituitary (A), pars intermediate (I), and posterior pituitary (P) with Plate 3B showing the anterior pituitary. The white arrow indicates an area of necrosis, Staining: H & E. Magnification: A: X100; B: X400 (Figure 3).
Figure 3 A & B Representative pituitary gland micrograph of Wistar rats for Group III (Given 100mg/kg b.w. AlCl3 for 2 weeks + ascorbic acid for 2 weeks). Plate 3A shows the anterior pituitary (A), pars intermediate (I), and posterior pituitary (P) with Plate 3B showing the anterior pituitary. The white arrow indicates an area of necrosis. Staining: H & E. Magnification: A: X100; B: X400.
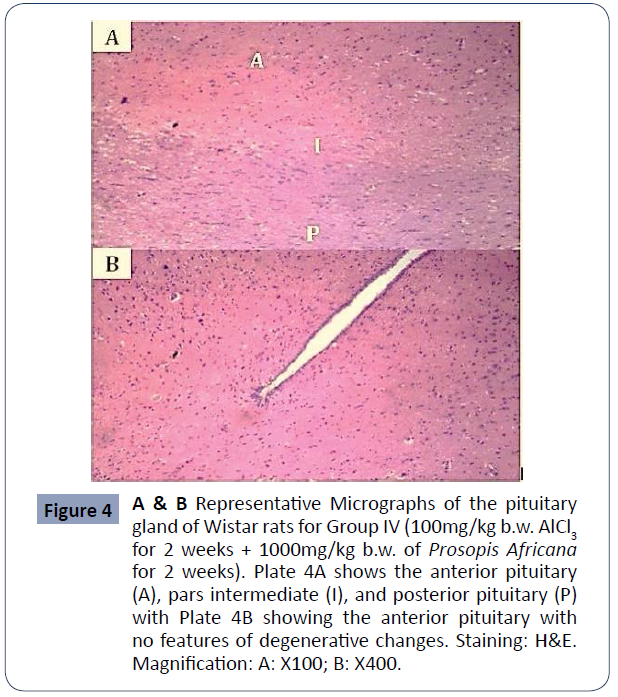
Figure 4A & B: Representative micrographs of the pituitary gland of Wistar rats for Group IV (100mg/kg b/wAlCl3 for 2 weeks + 1000mg/kg b/wof Prosopis Africana for 2 weeks). Plate 4A shows the anterior pituitary (A), pars intermediate (I), and posterior pituitary (P) with Plate 4B showing the anterior pituitary with no features of degenerative changes, Staining: H&E. Magnification: A: X100; B: X400 (Figure 4).
Figure 4 A & B Representative Micrographs of the pituitary gland of Wistar rats for Group IV (100mg/kg b.w. AlCl3 for 2 weeks + 1000mg/kg b.w. of Prosopis Africana for 2 weeks). Plate 4A shows the anterior pituitary (A), pars intermediate (I), and posterior pituitary (P) with Plate 4B showing the anterior pituitary with no features of degenerative changes. Staining: H&E. Magnification: A: X100; B: X400.
Figure 5 A & B: Representative micrographs of the pituitary gland of Wistar rats from Group V (100mg/kg b/wAlCl3 for 2 weeks + 500mg/kg b/wof Prosopis Africana for 2 weeks). Plate VA shows the anterior pituitary (A) and posterior pituitary (P) with Plate VB showing the showing areas with degenerative changes in the anterior pituitary (white arrows), Staining: H&E. Magnification: A: X100; B: X400 (Figure 5).
Figure 5 A & B Representative micrographs of the pituitary gland of Wistar rats from Group V (100mg/kg b.w. AlCl3 for 2 weeks + 500mg/kg b.w. of Prosopis Africana for 2 weeks). Plate VA shows the anterior pituitary (A) and posterior pituitary (P) with Plate VB showing the showing areas with degenerative changes in the anterior pituitary (white arrows). Staining: H&E. Magnification: A: X100; B: X400.
Figure 6 A & B: Representative micrographs of the pituitary gland of Wistar rats from Group VI (100mg/kg b.w of AlCl3 only). Plate 4.12A shows the anterior pituitary (A) and posterior pituitary (P) with Plate 4.12B showing the showing areas with degenerative changes (arrows), Staining: H&E. Magnification: A: X100; B: X400 (Figure 6).
Figure 6 A & B Representative micrographs of the pituitary gland of Wistar rats from Group VI (100mg/kg b.w of AlCl3 only). Plate 4.12A shows the anterior pituitary (A) and posterior pituitary (P) with Plate 4.12B showing the showing areas with degenerative changes (arrows). Staining: H&E. Magnification: A: X100; B: X400.
Reproductive Hormones
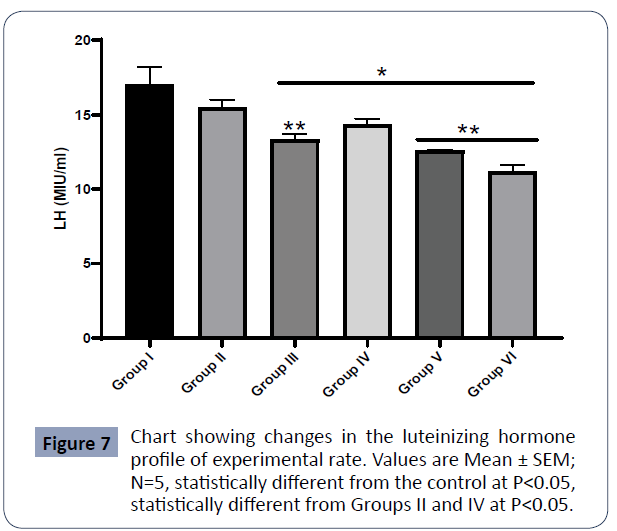
Figure 7: Chart showing changes in the luteinizing hormone profile of experimental rats. Values are Mean ± SEM; N=5, *statistically different from the control at P<0.05, statistically different from Groups II and IV at P<0.05 (Figure 7).
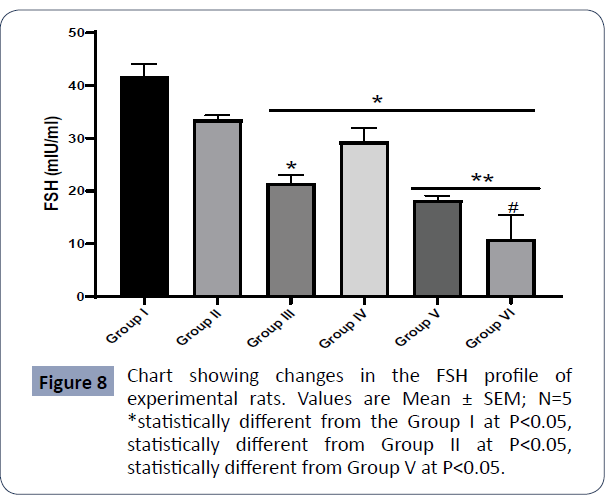
Figure 8: Chart showing changes in the FSH profile of experimental rats. Values are Mean ± SEM; N=5 statistically different from the Group I at P<0.05, statistically different from Group II at P<0.05, # statistically different from Group V at P<0.05 (Figure 8).
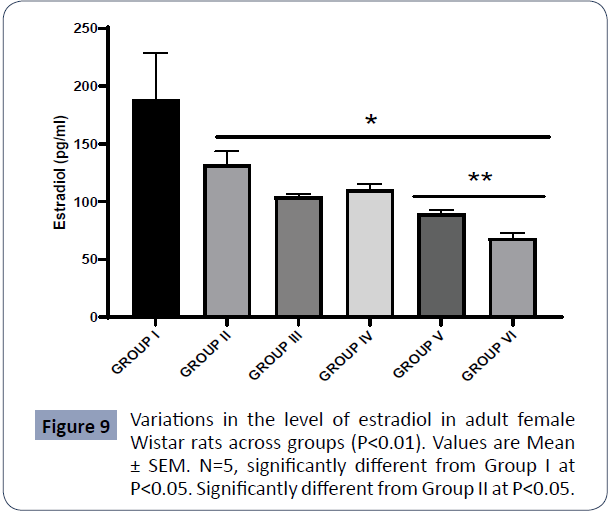
Figure 9: Variations in the level of estradiol in adult female Wistar rats across groups (P<0.01). Values are Mean ± SEM. N=5, significantly different from Group I at P<0.05, significantly different from Group II at P<0.05 (Figure 9).
Test for oxidative stress
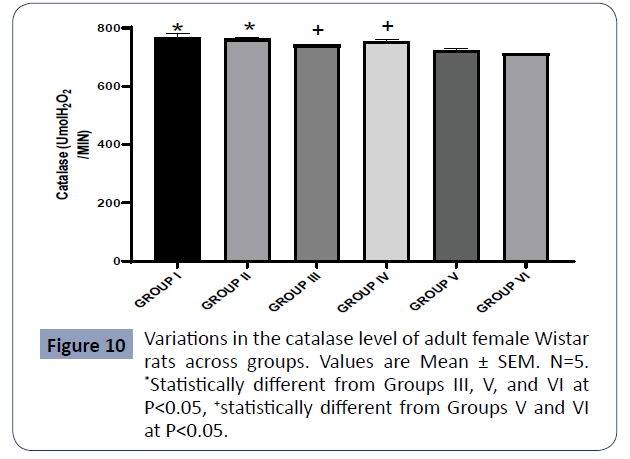
Figure 10: Variations in the catalase level of adult female Wistar rats across groups. Values are Mean ± SEM. N=5. Statistically different from Groups III, V, and VI at P<0.05, statistically different from Groups V and VI at P<0.05 (Figure 10).
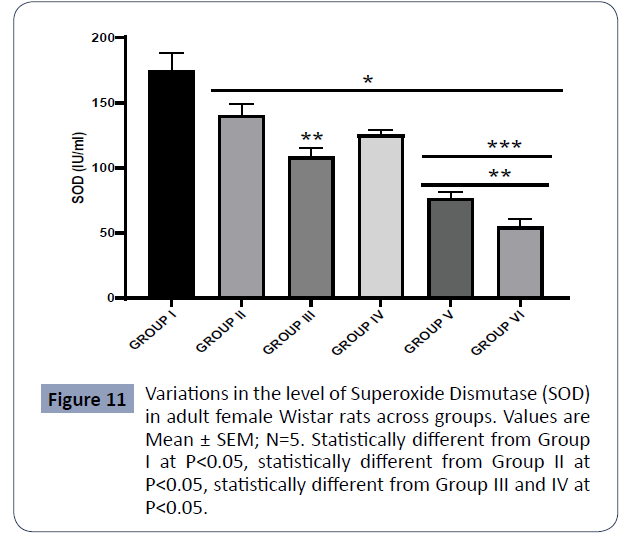
Figure 11: Variations in the level of Superoxide Dismutase (SOD) in adult female Wistar rats across groups. Values are Mean ± SEM; N=5. Statistically different from Group I at P<0.05, statistically different from Group II at P<0.05, statistically different from Group III and IV at P<0.05 (Figure 11).
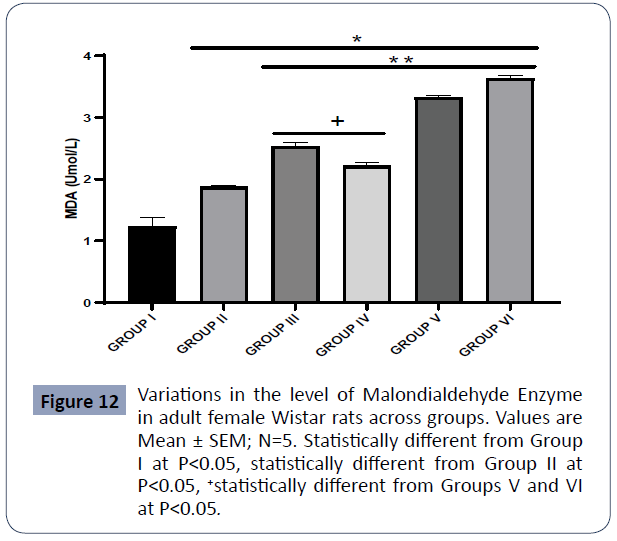
Figure 12: Variations in the level of Malondialdehyde Enzyme in adult female Wistar rats across groups. Values are Mean ± SEM; N=5. Statistically different from Group I at P<0.05, statistically different from Group II at P<0.05, statistically different from Groups V and VI at P<0.05 (Figure 12).
Data on LH are presented in Figure 1
The LH in the control group (I) was statistically higher than in Group III (AlCl3 + AA), Group IV (AlCl3 + 1000mg PA), Group V (AlCl3 + 500mg PA), and Group VI (AlCl3) at P<0.05.
The LH in Group II was statistically higher than in Group III (AlCl3 + AA), Group V (AlCl3 + 500mg PA), and Group VI (AlCl3) at P<0.01. There was no significant difference in the FSH between Group I (control) and Group II (PA) at P<0.05.
Results also showed that the FSH in Group IV (AlCl3) was statistically higher relative to Group III (AlCl3 + AA), Group V (AlCl3+ 500mg PA), Group VI (AlCl3) at P<0.05.
Data on FSH are presented in Figure 2
The FSH in the control group (I) was statistically higher than in Group III (AlCl3 + AA), Group IV (AlCl3 + 1000mg PA), Group V (AlCl3 + 500mg PA), and Group VI (AlCl3) at P<0.05.
The FSH in the control group (II) was statistically higher than in Group IV (AlCl3 + 1000mg PA), Group V (AlCl3 + 500mg PA), and Group VI (AlCl3) at P<0.01.
There was no significant difference in the FSH between Group I (control) and Group II (PA) at P<0.05.
Results also showed that the FSH in Group II (PA) was statistically higher relative to Group III (AlCl3 + AA), Group V (AlCl3 + 500mg PA), Group VI (AlCl3) at P<0.05.
Data on Estradiol are presented in Figure 3
The estradiol assayed in the control group (I) was statistically higher relative to Group II (PA), Group III (AlCl3 + AA), Group IV (AlCl3 + 1000mg PA), Group V (AlCl3 + 500mg PA), and Group VI (AlCl3) at P<0.05.
Also, the estradiol assayed in Group II (PA) was higher significantly in comparison to Group V(AlCl3 + 500mg PA) and Group VI (AlCl3) at P<0.05.
There was no significant difference in the estradiol between Group I (control) and Group II. (PA) at P<0.05.
Data on catalase are expressed in Figure 4
The catalase levels for Groups I and III were significantly higher relative to Groups V and VI at P<0.05. The catalase quantified in Group II was higher relative to Groups III (AlCl3 + AA), V (AlCl3 + 500mg PA) and VI (AlCl3) while that of Group IV (AlCl3 + 1000mg PA) was also statistically higher relative to Groups V(AlCl3 + 500mg PA) and VI (AlCl3) at P<0.05.
There was no significant difference in the catalase between Group I (control) and Group II. (PA) at P<0.05.
Data on superoxide dismutase (SOD) are expressed in Figure 5
The SOD level in the control (Group I) was statistically higher than in Group II (PA), Group III (AlCl3 + AA), Group IV (AlCl3 + 1000mg PA), Group V (AlCl3 + 500mg PA), and Group VI (AlCl3) at P<0.05. The SOD assayed in Group II (PA) was significantly higher relative to Groups III (AlCl3 + AA), V (AlCl3 + 500mg PA), and VI (AlCl3).
Also, the SOD levels in Groups III (AlCl3 + AA) and IV (AlCl3 + 1000mg PA) were higher relative to Groups V(AlCl3 + 500mg PA) and VI (AlCl3) at P<0.05.
Data on malondialdehyde (MDA) are expressed in Figure 6
The MDA content of the control (Group I) was statistically lower than in Group II (PA), Group III (AlCl3 + AA), Group IV (AlCl3 + 1000mg PA), Group V (AlCl3 + 500mg PA), and Group VI (AlCl3) at P<0.05. Likewise, the MDA content of Group II (PA) was statistically lower relative to Group III (AlCl3 + AA), Group IV (AlCl3 + 1000mg PA), Group V (AlCl3 + 500mg PA), and Group VI (AlCl3) at P<0.05.
The MDA levels of Groups III (AlCl3 + AA) and IV (AlCl3 + 1000mg PA) were statistically higher in comparison with Groups V (AlCl3 + 500mg PA) and VI (AlCl3) at P<0.05.
Discussion
The ovaries in the control group presented with optimum histological features. The cortical zone had several primordial follicles with the developing and matured follicles occupying the cortex. The oocyte was surrounded by the Zona pellucida, granulosa cell, and antrum varying according to the stage of maturation. The stroma ranged from dense in the cortical zones to loose in the medullary regions. Regressing corpus luteum from the previous cycle was observable in the cells. Group II animals’ histological features are very similar to those of the control. Areas of necrosis and degenerative lesions were observed in the ovaries of Group III animals. The stroma was looser in comparison to the control group. The majority of lesions were interstitial and epithelial changes. However, Group IV animals treated with 100mg/kg b/w of extract sequel to aluminum treatment presented improved histological appearance. Lesions were well reduced and the primordial follicular pool was appreciably increased. Also more developing follicles and regressing corpus luteum were observed in Group IV animals. The morphological integrity of the histology of Group V, animals rank somewhere between group III and IV animals. The reduced dosage of extract treatment in this group presented with a corresponding decline in the group’s histological features. The rete ovarii were more distended than those of groups II, III, IV, and control. Hemorrhages were also observable across the ovary. The highest degree of the pathological presentation was observable in group VI animals (AlCl3 only). In addition to pathology signs observed in other groups, central corpus luteum hemorrhage with central degeneration/necrosis was observable. Also, the ovaries were most scarred in this group of animals.
Functionally, the pituitary comprises of two parts; the adenohypophysis and the neurohypophysis. There is a comparatively small nonvascular zone within the two parts: the Intermediate Pars; The hypothalamic-pituitary-ovarian axis, which controls female reproductive activity, is a hormonal axis of the communication system between the hypothalamus, pituitary and ovary. The control (Group I) demonstrated normal morphology of the pituitary gland, with the anterior pituitary and posterior pituitary being more cellular, separated by the intermediate pars. The anterior pituitary gland contained clusters of cells that are grouped, according to their affinities to dyes, as chromophobes and chromophils. The chromophils are further grouped into acidophilic cells stained orange-brown, and basophilic cells stained dark blue, based on the hormones they produce [14]. The pituitary gland of Group II animals administered with 100mg/kg body weight of extract showed similar features to the control with distinct anterior pituitary, posterior pituitary, and pars intermediate with their corresponding cells. The cell population is, however, fewer than those of the control and very few degenerative changes presented in looseness of stroma could be observed. Group III animals administered with ascorbic acid after aluminum withdrawal presented with few pathologies most notably being hemorrhages. The pars intermediate are well reduced. The pituitary cell population is also reduced compared to Groups IV, II, and control animals. Treatment was most effective histologically in Group IV animals which were treated with 1000mg/kg b/w of the extract (high dose). The anterior pituitary and posterior pituitary were distinctly separated by pars intermediate. Chromo phobic, acidophilic and basophilic cells were also identifiable in H and E stain. Normal vasculature was also observed and the cell population was similar to those of the control group. In Group V animals, effects of aluminum toxicity were least reversed by treatment. The cell density was reduced in the anterior pituitary and the posterior pituitary inconsistent in comparison to Groups II, III, IV, and control. The pituitary stroma was loose and the area of necrosis was observable. The histology of this group, however, showed very marked improvement to those of Group VI animals which had no treatment.
The histological features of Group VI animals were most distorted. The anterior pituitary presented infrequent cells present with fading stains, large stoma with vacuole formation notable areas of necrosis, and degenerative changes. Hemorrhages were also observable in the histology of these groups' pituitary. These changes could be attributed to the high level of oxidative stress induced by aluminum toxicity in this group.
The control animals showed the highest hormone levels followed by animals treated with extract only (Group II). This effect was statistically important in estradiol but not in follicle-stimulating hormone and luteinizing hormones. In the trend, the use of high dose treatment group III produced the third-highest hormone level. Statistically, there was no significant difference (p<0.05) in the hormone levels of animals treated with extract only, and those treated with the same dose of the extract after aluminum toxicity had been induced. The use of a high dose of extract was more potent than the use of ascorbic acid (Group III), a standard drug acceptable in treating ovarian toxicity. The LH levels of animals treated with ascorbic acid did not show any significant difference relative to extract-treated groups IV and V, indicating that they have comparable effects. Notably, animals treated with extract only showed significant differences relative to other groups except group I and group IV. Moreover, the LH levels of group IV animals differed significantly relative to groups III, V, and VI. This marked difference in hormonal levels between high dose group IV and low dose (group V) of the extract treatment indicates that the mitigating effects of the extracts in a toxic ovary are dose-dependent. Hormone levels were lowest in group VI treated with aluminum only as also reported by Chinoy and Bhattacharya [1]. This corresponds with the several pathologies observed in the histology of the group. Only the luteinizing hormone level showed a significant difference between Group V and Group VI. The hormone profiles relative to the histology of ovaries and pituitary indicates that the degree of consistency of histological sections with the control is dependent on the hormone levels. i.e., the higher the hormone levels the higher the consistency with control and the lesser the hormone levels the more pathologic features could be observed in the histological sections. Therefore, the extract has positive effects on steroid genesis. Moreover, the production of luteinizing hormone and follicle-stimulating hormone in the pituitary gland directly influences and is proportional to estradiol production. Animal groups with high luteinizing hormone and follicle-stimulating hormone production produce correspondingly high estradiol levels while groups with low follicle-stimulating hormone and luteinizing hormone production had correspondingly low estradiol levels. This variation may be attributed to the differences in the basophilic cells population of the anterior pituitary and the granulose, the cells of the ovaries.
The biochemical findings in this study showed that malondialdehyde levels were markedly significant (p<0.05). A high generation of malondialdehyde (MDA) indicates lipid peroxidation. Additionally opined that peroxidation and oxidation of cell lipids produce free radicals causing oxidative stress. Malondialdehyde level was highest in animals induced with aluminum only with the lowest level in control animals. There were marked significant differences in the Malondialdehyde levels across and between groups except between aluminum and low dose; ascorbic acid and a high dose which showed no significant difference [13, 14]. Exposure to aluminum chlorideinduced oxidative stress and increased malondialdehyde levels in agreement with Conversely, catalase and superoxide dismutase levels followed a similar trend with the highest value recorded in group I animals (control) and the lowest levels in aluminum treated rats (Group VI). Statistically, there was no significant difference in the catalase and superoxide dismutase enzyme levels of animals treated with extract only and those treated with a high dose [1]. Reported that superoxide dismutase is an antioxidant that reduces free oxygen radicals to hydrogen
peroxide and molecular oxygen while catalase converts hydrogen peroxide into water and oxygen [11]. Oxidative stress and a failure of the antioxidant defense mechanism can be implicated in the ovarian abnormalities observed in histological sections of the ovary and pituitary gland. The higher the levels of malondialdehyde enzyme the higher the oxidative stress, the less the hormone levels, and conversely the more pathologic the histology. Conversely, the lower the malondialdehyde levels the lower the oxidative stress, the higher the hormone, and the better the histological presentation. Since antioxidants mop up free radicals, an increase in malondialdehyde level causes a reduction in antioxidants. This process reverses the effects of oxidative stress on the ovaries and the pituitary gland. Various substances used in this study showed differing anti-oxidant effect marked by the catalase and superoxide dismutase levels. The ability of Prosopis africana aqueous ethanoic-stem-bark extract to produce effects similar to and more potent than those of ascorbic acid, a well-known anti-oxidant strongly suggests that the extract has a good anti-oxidant effect. Moreover, the ability of the extract to increase superoxide dismutase levels supports this observation [14].
Conclusion
It has been deduced from our study that Prosopis africana is a potent anti-oxidant. At 1000mg/kg body weight Prosopis africana ethanoic stem-bark extract is more therapeutic than 20mg/kg bodyweight of ascorbic acid, a standard drug used as an anti-oxidant. Prosopis africana ethanolic stem-bark extract increased follicle-stimulating hormone and luteinizing hormones production in the anterior pituitary and estradiol production in the ovary. There was appreciably reversed in the histological alterations induced by aluminum toxicity in the ovary and pituitary gland after treatment with Prosopis Africana ethanolicstem- bark extract.
Acknowledgments
The authors are thankful to the authorities of the Federal University of Technology Akure for the animal house and lab facilities for this study.
Author contributions
Olawuyi T. S. and Ukwenya V. O. designed the experiment. Ogunjemite I. O. performed the experiments. Akinola B. K. helped in data interpretation. Ogunjemite I. O. wrote the manuscript. Olawuyi T. S. and Ukwenya V. O edited the final write up.
Conflicting interests
The authors declare that there is no conflict of interests
References
- Chinoy NJ and Bhattacharya S (1997) Affects of chronic administration of aluminum chloride on reproductive functions of the testis and some accessory sex organs of male mice. Indi J Environ Toxi 7:12-5.
- Halliewll B and Cutteridge JM (1990) Role of free radical and Catalytic metal ions in human disease. An overview method enzyme 186:1-85.
- Rangbar A, Khani-Jazani R, Sedighi A, Jalali-Mashayekhi F, Ghazi-Khansari M et al. (2008) Alteration of body total antioxidant capacity and thiol molecules in human chronic exposure to aluminum. J Toxi of Environ Chemi 90:707-713.
- Mohammadirad A and Mohammad A (2011) A systematic review on oxidant/ Antioxidant imbalance in Aluminium toxicity. Intern J of Pharma 7(1):12-21.
- Olawuyi TS (2017) Effects of Lawsona inermis in mitigating oxidative stress in the pituitary-ovarian axis after inducing aluminium chloride 1-150.
- Abah JO (2014) Pharmacognostics and antiulcer evaluation of stembark of Prosopis Africana 1-90.
- Burkhill HM (1995) The Useful Plants of West Africa. J Royal Botan Gard 2: 258–260.
- Kolapo AL, Okunade MB, Adejumobi JA, Ogundiya MO (1990) Phytochemical Composition and Antimicrobial Activity of Prosopis africana Against Some Selected Oral Pathogens. Wor J of Agri Sci 5(1), 90 - 93.
- Holford J, Raynaud F, Murrer BA, Grimaldi K, Hartley JA, et al. (1998) Chemical, biochemical and pharmacological activity of the novel sterically hindered platinum co-ordination complex, cis-[amminedichloro (2-methylpyridine)] platinum (II) (AMD473). Antican Drug Des 13:1–18.
- Wennink JM, Delemarre-van de Waal HA, Schoemaker R, Schoemaker H, Schoemaker J (1990) Luteinizing hormone, follicle stimulating hormone, Progesterone and Estradiol Hormone secretion patterns in girls throughout puberty measured using highly sensitive immunoradiometric assays. Clini Endocri 33(3):333-44.
- Simoni M, Gromoll J, Nieschlag E (1997) The follicle stimulating hormone receptor: biochemistry, molecular biology, physiology and pathophysiology. Endocrin Revi 18: 739-773.
- Stocks J and Dormandy T (1971) the autoxidation of Human Red Cell Lipids induced by Hydrogen Peroxide. Briti J of Hemato 20, 95-111.
- Lucesoli F, Fraga CG (1995) Oxidative damage to lipids and DNA concurrent with decrease of antioxidants in rat testes after acute iron intoxication. Arch Biochem Biophy 316:567-571.
- Xia W, Cheng CY (2005) TGF beta 3 regulates anchoring junction dynamics in the seminiferous epithelium of the rat testis via the RAS/ERK signaling pathway. An in vivo study. Develo Bio 280: 321-343.
Open Access Journals
- Aquaculture & Veterinary Science
- Chemistry & Chemical Sciences
- Clinical Sciences
- Engineering
- General Science
- Genetics & Molecular Biology
- Health Care & Nursing
- Immunology & Microbiology
- Materials Science
- Mathematics & Physics
- Medical Sciences
- Neurology & Psychiatry
- Oncology & Cancer Science
- Pharmaceutical Sciences

